
APK-gebreken & betrouwbaarheid
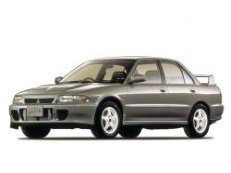
Mitsubishi Lancer Evolution
APK betrouwbaarheid
APK-gebreken analyse van 111 Mitsubishi Lancer Evolution voertuigen — uitgesplitst naar 9 generaties en bouwjaren van 1994 tot 2015.
Hoe betrouwbaar is de Mitsubishi Lancer Evolution?
Op basis van 111 APK-keuringen verspreid over bouwjaren 1994–2015 en 9 opeenvolgende generaties laten we zien hoe de Mitsubishi Lancer Evolution veroudert. Per generatie zie je het afkeurpercentage per leeftijd in jaren — zo herken je in één oogopslag welke jaren binnen een generatie technisch sterk zijn en welke meer zorg vragen.
Onder iedere generatie vind je de beschikbare bouwjaren met het aantal voertuigen in onze dataset. Klik door naar een specifiek bouwjaar voor de volledige analyse: welke gebreken opvallen, welke brandstofvarianten verschillen en wat dat betekent voor onderhoud en aanschafbeslissingen.
Generaties
APK Betrouwbaarheid per generatie Mitsubishi Lancer Evolution
Iedere generatie heeft zijn eigen techniek, gewicht en zwakke plekken. Hieronder zie je per generatie de afkeur-kans per leeftijd, op basis van echte APK-keuringen.
Generatie 2007–2017
X (CA)
51 voertuigen ·
7 bouwjaren
Brandstof
Benzine
100%
Gewicht
Middenklasse
100%
Generatie 2007–2017
X (CA)
51 voertuigen · 7 bouwjaren
351 observaties · 51 afkeuringen
Jaarlijkse afkeurkans
14,5%
per voertuig-jaar in cohort
67% van auto's ooit afgekeurd
Beste leeftijd
—
onvoldoende data
Slechtste leeftijd
—
onvoldoende data
Gemiddelde: 31,6% Vergeleken met 2.877.303 observaties op leeftijd 9–19 (11 leeftijdsbuckets). Gewogen op de brandstof- en gewichtsverdeling van deze generatie — geen vergelijking met fundamenteel andere voertuigen. -18% advies Advies / reparatieadvies: beter dan gemiddelde Dit cohort: 11,7%
Gemiddelde: 14,3% Vergeleken met 2.877.303 observaties op leeftijd 9–19 (11 leeftijdsbuckets). Gewogen op de brandstof- en gewichtsverdeling van deze generatie — geen vergelijking met fundamenteel andere voertuigen. leeftijd 9 — 19 jaar
Bouwjaren
Generatie 2005–2007
IX (CT)
25 voertuigen ·
3 bouwjaren
Brandstof
Benzine
100%
Gewicht
Middenklasse
100%
Generatie 2005–2007
IX (CT)
25 voertuigen · 3 bouwjaren
167 observaties · 22 afkeuringen
Jaarlijkse afkeurkans
13,2%
per voertuig-jaar in cohort
56% van auto's ooit afgekeurd
Beste leeftijd
—
onvoldoende data
Slechtste leeftijd
—
onvoldoende data
Bouwjaren
Generatie 2003–2005
VIII (CT)
28 voertuigen ·
3 bouwjaren
Brandstof
Benzine
100%
Gewicht
Middenklasse
75%
Compact
25%
Generatie 2003–2005
VIII (CT)
28 voertuigen · 3 bouwjaren
188 observaties · 41 afkeuringen
Jaarlijkse afkeurkans
21,8%
per voertuig-jaar in cohort
79% van auto's ooit afgekeurd
Beste leeftijd
—
onvoldoende data
Slechtste leeftijd
—
onvoldoende data
Bouwjaren
Generatie 2001–2003
VII (CT)
14 voertuigen ·
2 bouwjaren
Brandstof
Benzine
100%
Gewicht
Middenklasse
57%
Compact
43%
Generatie 2001–2003
VII (CT)
14 voertuigen · 2 bouwjaren
98 observaties · 25 afkeuringen
Jaarlijkse afkeurkans
25,5%
per voertuig-jaar in cohort
86% van auto's ooit afgekeurd
Beste leeftijd
—
onvoldoende data
Slechtste leeftijd
—
onvoldoende data
Bouwjaren
Generatie 1999–2000
VI (CP)
5 voertuigen ·
2 bouwjaren
Brandstof
Benzine
100%
Gewicht
Compact
60%
Middenklasse
40%
Generatie 1999–2000
VI (CP)
5 voertuigen · 2 bouwjaren
30 observaties · 5 afkeuringen
Jaarlijkse afkeurkans
16,7%
per voertuig-jaar in cohort
60% van auto's ooit afgekeurd
Beste leeftijd
—
onvoldoende data
Slechtste leeftijd
—
onvoldoende data
Bouwjaren
Generatie 1998–1998
V (CP)
1 voertuigen ·
1 bouwjaren
· onvoldoende data voor curve
Brandstof
Benzine
100%
Gewicht
Middenklasse
100%
Generatie 1998–1998
V (CP)
1 voertuigen · 1 bouwjaren · onvoldoende data voor curve
Bouwjaren
Generatie 1996–1997
IV (CN)
9 voertuigen ·
2 bouwjaren
Brandstof
Benzine
100%
Gewicht
Compact
67%
Middenklasse
33%
Generatie 1996–1997
IV (CN)
9 voertuigen · 2 bouwjaren
61 observaties · 8 afkeuringen
Jaarlijkse afkeurkans
13,1%
per voertuig-jaar in cohort
56% van auto's ooit afgekeurd
Beste leeftijd
—
onvoldoende data
Slechtste leeftijd
—
onvoldoende data
Bouwjaren
Generatie 1995–1995
III (CE)
5 voertuigen ·
1 bouwjaren
Brandstof
Benzine
100%
Gewicht
Compact
100%
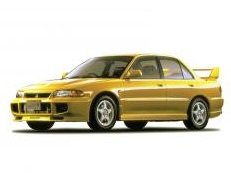
Generatie 1995–1995
III (CE)
5 voertuigen · 1 bouwjaren
30 observaties · 4 afkeuringen
Jaarlijkse afkeurkans
13,3%
per voertuig-jaar in cohort
60% van auto's ooit afgekeurd
Beste leeftijd
—
onvoldoende data
Slechtste leeftijd
—
onvoldoende data
Bouwjaren
Generatie 1994–1994
II (CE)
2 voertuigen ·
1 bouwjaren
· onvoldoende data voor curve
Brandstof
Benzine
100%
Gewicht
Compact
100%
Generatie 1994–1994
II (CE)
2 voertuigen · 1 bouwjaren · onvoldoende data voor curve
Bouwjaren
Alternatieven
Vergelijkbare auto's als de Mitsubishi Lancer Evolution
Andere modellen met vergelijkbare grootte en prijsklasse, vergeleken op betrouwbaarheid. Hoeveel procent van deze auto's is ooit afgekeurd, vergeleken met de Mitsubishi Lancer Evolution?
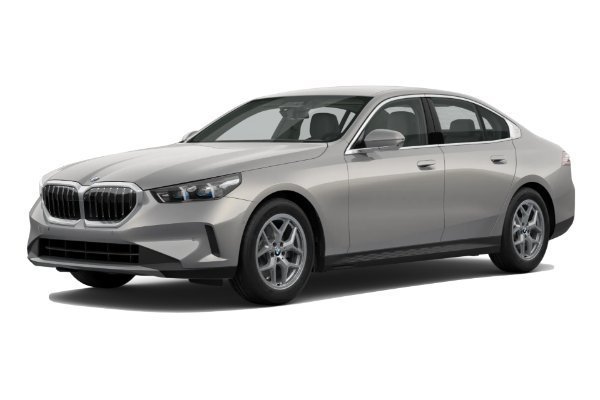
BMW 5 Serie
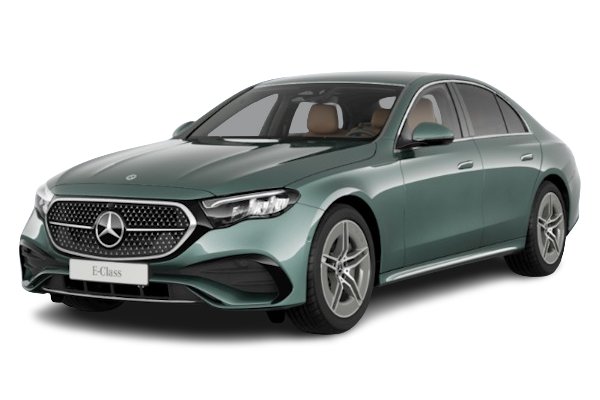
MERCEDES-BENZ E
AUDI A6
BMW 4-Serie

VOLVO XC70
BMW X4
Vergelijking op basis van het percentage voertuigen dat ooit een APK-afkeur heeft gehad in onze data. Modellen met vergelijkbare gewichtsklasse, zitplaatsen en prijssegment als de Mitsubishi Lancer Evolution — geen vergelijking met fundamenteel andere voertuigen.
Veelgestelde vragen
Veelgestelde vragen over Mitsubishi Lancer Evolution
Welke generatie van de Mitsubishi Lancer Evolution is het meest betrouwbaar?
Welke Mitsubishi Lancer Evolution generatie geeft de meeste APK-problemen?
Hoeveel APK-gebreken heeft een Mitsubishi Lancer Evolution gemiddeld?
Waar zijn deze betrouwbaarheidscijfers op gebaseerd?
Hoe kan ik een specifieke Mitsubishi Lancer Evolution controleren?
Check een specifieke Mitsubishi Lancer Evolution
Heb je een specifiek kenteken? Bekijk de volledige APK-historie en betrouwbaarheidsanalyse van een individuele Mitsubishi Lancer Evolution.